How Much Should a Growing Business Budget for Marketing?
Why the standard benchmark misleads growth-stage CEOs, and how to determine the right budget.

Setting a marketing budget can be challenging. Should you increase your budget by a percentage more than the previous year? How do you know what your competitors are spending? How should your marketing budget compare to other line items?
The good news is there are benchmarks for marketing spend. The bad news is that there is limited data for small and mid-sized businesses.
In this piece, we will give you guidelines for developing a marketing budget that works for your business. We’ll do that in two steps:
Market Data: Showing you benchmarks for what businesses of your size, industry, and business model are spending on marketing; and
Your Company Data: Walking you through how to fine-tune the benchmarks based on your growth goals, unit economics, and realistic funding ability.
First, a Note on Data Sources
The Gartner CMO Spend Survey is one of the most widely cited sources for marketing budget benchmarks. According to the survey, the average business budgets 7.7% of its annual revenue for marketing.
Here’s the challenge: that number reflects a survey of 402 marketing leaders, the vast majority of whom are at companies doing over $1 billion in annual revenue. Those companies have established brands, mature customer pipelines, and decades of compounding awareness working in their favor. The CMOs surveyed by Gartner are optimizing an existing marketing engine, not building one.
If you are running a business doing $5 million to $50 million in revenue and have ambitions to grow aggressively, using the 7.7% benchmark for your marketing budget is likely to leave you under-resourced at exactly the moment investment matters most.
To understand what small and mid-sized businesses spend on marketing, we turn to the Duke/Deloitte CMO Survey. This tells a more nuanced story than Gartner’s enterprise-heavy sample because it draws from a broader range of company sizes. Two caveats apply: sample sizes at the lower revenue bands are small, and standard deviations are wide. These are directional signals rather than precise targets. That said, the direction is meaningful and consistent.
For context, marketing budgets typically cover four categories of spend:
Advertising (either digital or non-digital);
Marketing technology (the tools and platforms that power your campaigns);
Labor (in-house marketing staff); and
External service providers (agencies and freelancers).
Part 1: What Does the Data Say Small and Mid-Sized Businesses Are Actually Spending on Marketing?
When first putting together your marketing budget, it is helpful to start by understanding what other companies are doing across your business size, industry, and business model. These benchmarks allow you to triangulate to a percentage of annual revenue for your marketing budget.
Marketing Spend by Revenue Stage
If you are running a small or mid-sized growing business, marketing spend by revenue stage is the most important benchmark to keep in mind. As you look at industry-specific or business-model-specific data, this is the benchmark to anchor to because businesses that want to grow need to invest significantly more into marketing than mature companies. Later on in this article, we’ll share with you industry-specific and business-model-specific data, but that data is drawn from businesses of all sizes. This can make it seem like you should be investing less into marketing than you maybe should be.
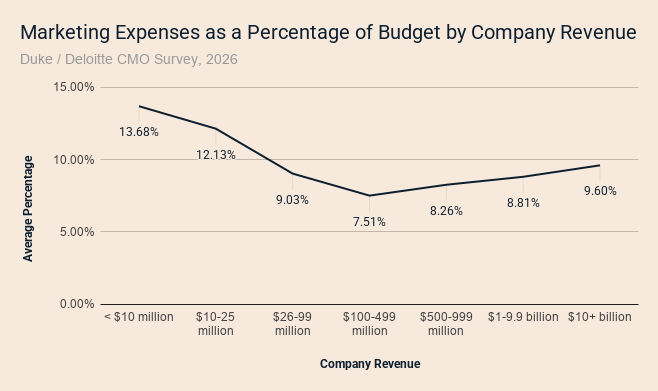
Marketing spend as a percentage of a company’s budget is highest for businesses doing less than $25 million in revenue. These growing businesses are first trying to demonstrate product-market fit, and then get traction. They are pushing through growth plateaus. This investment reflects the real cost of breaking through to the next level of scale. Spend moderates only later, as brand recognition compounds and acquisition becomes more efficient.
Marketing investment alone does not cause growth, but the correlation between above-average marketing spend and above-average growth is consistent enough to treat as a meaningful signal when calibrating your own budget. If your business is in the growth phase and spending at or near the Gartner headline average of 7.7%, you are likely under-investing relative to your peers who are growing aggressively.
To illustrate what this might mean for your business, here are a few examples of company revenue and how these benchmarks translate into annual and monthly marketing budgets.
| Annual Revenue | % for Marketing | Annual Budget | Monthly Budget |
|---|---|---|---|
| $5 million | 14% | $700,000 | $58,333 |
| $20 million | 12% | $2,400,000 | $200,000 |
| $35 million | 9% | $3,150,000 | $262,500 |
Note: In these examples, we assume that the company’s budget is the same as its annual revenues, which is not always the case.
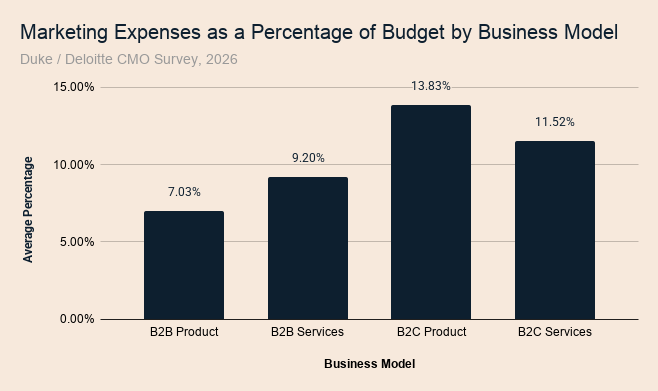
Marketing Budget by Business Model
B2C product companies spend more than twice what B2B product companies spend, and for structural reasons: they compete for consumer awareness and discovery in a way that demands persistent investment. B2B services firms, which grow more heavily through relationships and referrals, face a different acquisition dynamic and can operate at a lower percentage without sacrificing growth.
One figure worth noting separately for digitally native businesses: companies that conduct 100 percent of their sales online report spending a mean of 19.61% of budget on marketing. Customer acquisition in a purely digital environment is expensive, and the companies succeeding at it are investing accordingly.
Marketing Budget by Industry
Marketing needs vary by industry, just as they do by business model. When you find your industry in this chart, do not focus specifically on the marketing spend percentage number since it is an average of businesses of all sizes. Instead, consider how it compares to other industries. Is your business in an industry that tends to spend more on marketing, or one that often spends little on it?

To illustrate what this might mean for your business, let’s consider a $5 million revenue company. Companies of this size are budgeting an average of 11% of revenue to marketing. Here are three examples of how you might adjust that number up or down based on industry data and business model data.
| Company Type | Baseline Adjustment | % for Marketing | Annual Budget | Monthly Budget |
|---|---|---|---|---|
| Average | - | 14% | $700,000 | $58,333 |
| Consumer Services | ↑↑ spend (industry mean 19%) | 17% | $850,000 | $70,833 |
| Education | ↓ spend (industry mean 11.5%) | 12.5% | $625,000 | $52,083 |
| Construction | ↓↓ spend (industry mean 3%) | 9.00% | $450,000 | $37,500 |
Part 2: What Your Own Business Tells You
The benchmarks give you a range of what other businesses like yours might be spending on marketing. But that is not sufficient to determine a marketing budget for your company specifically. To decide on a marketing budget within the range of industry benchmarks (or outside of it), here are three lenses through which to examine your budget. We’ll walk you through each one:
What do your growth goals require?
What do your unit economics tell you?
What can you realistically fund today?
Lens 1: What Do Your Growth Goals Require?
The marketing budgeting benchmarks reflect a mix of growth ambitions across the companies at that revenue range, in the industry, and in the business model. When setting a marketing budget, CEOs should consider growth goals. The marketing investment should reflect your growth destination, not your starting point.
A practical way to anchor this is through three growth scenarios. If your goal is maintenance (in other words, holding current revenue and defending market share), then the lower end of your industry benchmark range is likely sufficient. Your marketing investment should focus on retention and visibility rather than aggressive acquisition.
If you are targeting moderate growth of 10 to 20 percent, budget toward the middle to upper end of your benchmark, sized against where you want to be a year from now rather than where you are today.
If you are pursuing aggressive growth, doubling revenue or more within a defined timeframe, the math changes more significantly. You might consider investing closer to what a company in your target revenue range would.
Consider, for example, a $3 million business aiming to reach $6 million in three years. Following the 14% benchmark for under-$10-million-revenue businesses, the $3 million business might allocate $420,000 to marketing, while its $6 million target would allocate $840,000. To double in 3 years, investing closer to $840,000 than to $420,000 might give the aggressive goal a realistic chance.
Businesses serious about growth should expect to sit at the upper end of the benchmark range, and in some cases, beyond it.
In sum:
Maintenance → lower end of benchmark ranges
Moderate 10% - 20% growth → middle of benchmark ranges
Aggressive 100%+ growth → upper end or exceeding benchmark ranges
Lens 2: What Do Your Unit Economics Tell You?
The growth goal calculation tells you how much to spend. Your unit economics tell you whether that spend is sustainable and what return threshold you should expect.
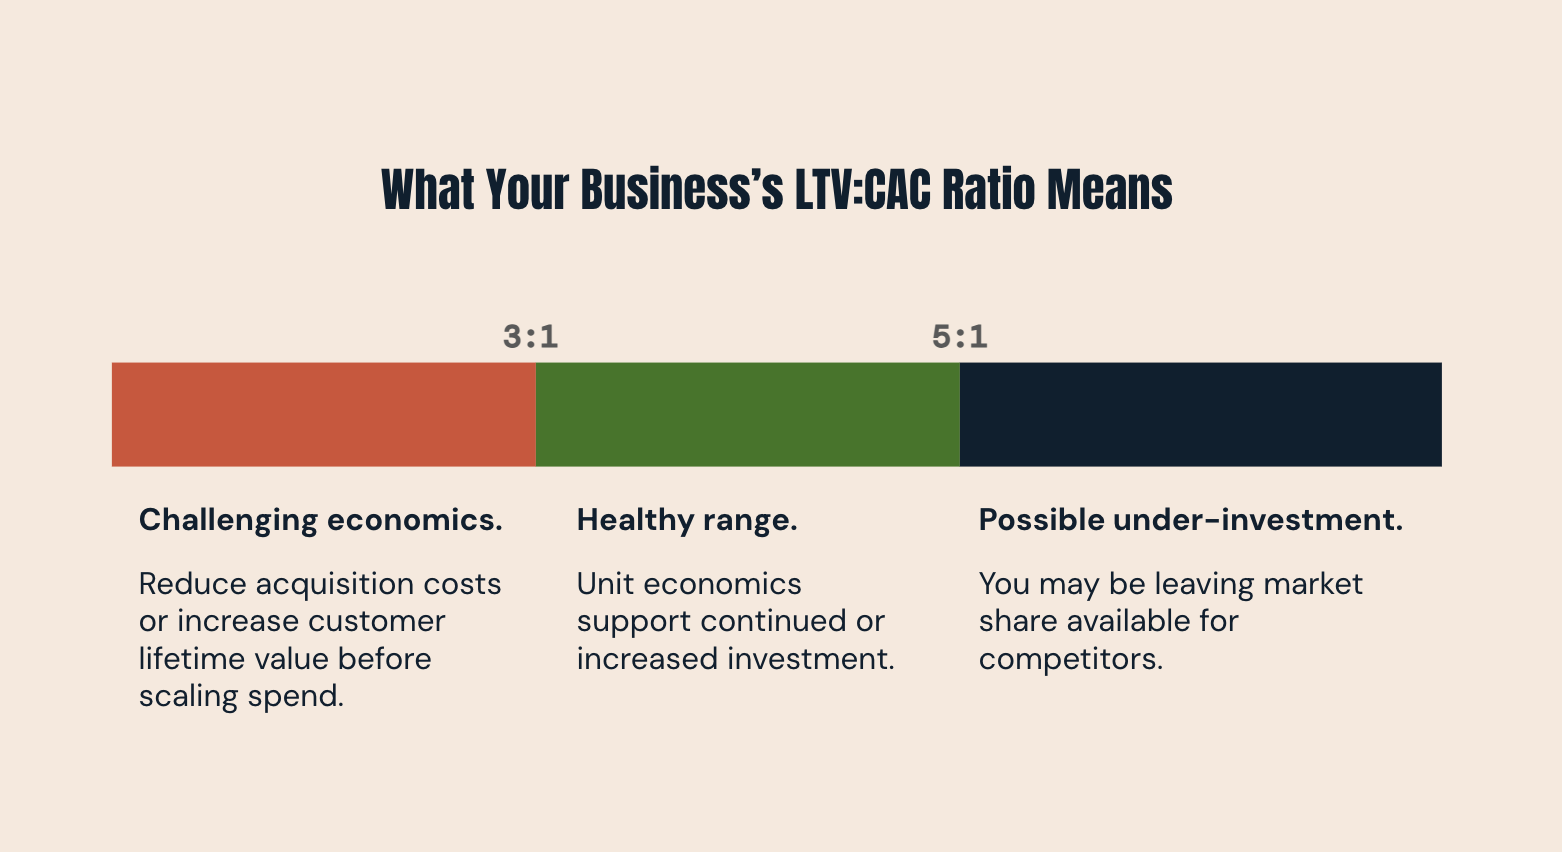
The relevant metric is the ratio of customer lifetime value (CLV) to customer acquisition cost (CAC). CAC encompasses all of your marketing investment, not just advertising spend: it is the total cost of every channel, campaign, and activity that contributes to bringing in a new customer, divided by the number of customers acquired.
The widely accepted benchmark for a healthy business is 3 to 1: for every dollar spent acquiring a customer, that customer should generate at least three dollars in lifetime value. A ratio above 5 to 1 often signals under-investment, meaning you are leaving growth available for competitors. A ratio below 3 to 1 suggests the customer acquisition strategy needs optimization before you scale it further.
For a CEO pursuing aggressive growth, a 3 to 1 ratio or better is data-backed justification to increase spend toward the destination budget. If your ratio is below 3 to 1, a larger budget will not fix the underlying problem. The right move is to improve conversion rates, strengthen retention, or both, before spending more to acquire customers.
This ratio also does something a benchmark percentage cannot: it converts marketing from an expense line into a measurable investment with a defined return threshold. It answers the question that marketing always raises, which is how you will know whether the spend is working.
Lens 3: What Can You Realistically Fund Today?
Before committing to a marketing budget, it is worth examining the constraints that determine what your business can actually sustain.
The margin structure of your business is the most fundamental. A business running on 5% margins operates in a fundamentally different reality than one running on 20% margins, even at identical revenue. The benchmark percentages are a useful reference point, but if your margins are thin, the path to a larger marketing budget often runs through margin improvement first or the deliberate decision to accept lower short-term profitability in exchange for the growth that increased investment is expected to produce.
Marketing is also competing against other capital priorities: hiring, technology, equipment, and debt service are drawing from the same pool of available cash. Being honest about those competing claims helps you arrive at a number you can actually commit to rather than one that looks right on paper but gets cut the first time revenue dips.
If the number your growth goal requires is not fully fundable today, consider building a sequenced marketing budget. What can you invest now that moves the needle and builds toward the full budget over 12 to 24 months? A phased approach that increases marketing investment as revenue grows is more sustainable than either under-investing indefinitely or over-committing and pulling back.
Where Does the Marketing Budget Actually Go?
Once you have a total number in mind, the next question is how to deploy it. According to Gartner's 2025 CMO Spend Survey, marketing spend across large enterprises breaks down into four broad categories, and while proportions shift for smaller businesses, the categories themselves are consistent and useful for planning.

Many CEOs, when they map their current spending across these four categories, find they are already investing more than they thought. The spend exists. It is simply uncoordinated, distributed across tools, vendors, and part-time attention without a strategy connecting it.
After Establishing Your Marketing Budget, What’s Next?
Arriving at the right number is the tractable part of this problem. The benchmark data gives you a range. The growth goal framework gives you a starting calculation. The lifetime value to acquisition cost ratio gives you a sustainability check. These tools exist, and a disciplined CEO can work through them.
The harder question is who owns this process on an ongoing basis. Setting the budget is a one-time decision. Deploying it across the right channels, building the tracking infrastructure to measure what is working, monitoring performance as market conditions shift, and adjusting the mix accordingly, that is continuous work requiring genuine marketing expertise. According to Gartner's 2025 CMO Spend Survey, 64% of marketing leaders cite demonstrating the impact of marketing on financial outcomes as their single biggest challenge. That gap does not close by spending more. It closes when someone with the right expertise owns the problem.
For most growing businesses, that expertise does not exist in-house, and building it is more expensive and time-consuming than most CEOs anticipate. The high-growth firms that consistently out-invest and out-perform their peers share something beyond their budget size: they treat marketing as a strategic function with dedicated ownership, not as a set of tasks managed around the edges of everything else.
At Mariner11, we serve as the senior marketing team for businesses at exactly this stage: setting the strategy, building the measurement infrastructure, and managing the execution so that leadership can stop managing marketing activity and start evaluating marketing results.
If you are working through setting a marketing budget and want a second perspective, we are happy to get on a call.
Related Reading
Trying to plan your marketing budget? Schedule a discovery call to learn how we can help you plan for your growth.